Randomly valuing property: A Machi Koro investigation
26 Dec 2019In addition to the various computer-ey things that I do, I also like to play boardgames with my friends sometimes. One such game that I like to play is Machi Koro. Machi Koro will be the topic of today’s post so if you’ve never played it, you may want to watch a lets-play of it or something before continuing.
I recently acquired my own copy of it (along with the Harbor and Millionaire’s Row expansions) and started playing it with other people who’d never seen it before. One such person - after a particularly frustrating game where every other player had at least one Tuna Boat and he’d invested heavily in Apple Orchards - commented that Tuna Boats were over-powered and that Apple Orchards are made entirely redundant by the Harbor landmark.
I’ve often toyed with the idea of making some form of AI to play the various boardgames I’m interested in and in this case I thought it would be interesting to do something to that effect to see how the game itself plays. Is it true that Tuna Boats are over-powered? Is it true that Apple Orchards are simply bad when faced with the existence of the Harbor and any establishments with an activation value greater than 11? I set out to see if we could find any interesting answers. I decided I wasn’t invested enough to attempt to construct a successful AI to actually play the game but resolved to at least model the game rules so I could run a Monte-Carlo simulation of it and see what happened.
How the game is played
I should start out by noting the specific way in which my simulation plays the game. There are a few variations of the rules for Machi Koro and I expect they play differently but I’ve only ever played one way. We will be playing what the rules call the “Hybrid Supply Variant”. In this variant there are 3 decks from which establishments are randomly drawn, forming several piles from which players can make their purchases. One deck contains all the major establishments and 2 piles are drawn from it. The other two decks split the remaining establishments into those that activate on a roll of 6 or less and those that activate on a roll of 7 or higher. 5 decks are drawn from both of these decks.
I should also note that I did not implement the full set of cards. I left out (most of) the Millionaire’s Row cards because they have their own unique complicates and we can still answer our questions about Tuna Boats and Apple Orchards even if those are excluded. I similarly left out the Business Centre.
One final thing to note before we get down to business is that some cards have slightly different names in different prints of the game. For example I have cards called “Farmers Market” but in a friend’s copy of the game they’re called “Fruit And Vegetable Market”. I am not sure why this is the case but at least the cards do the same thing, so it doesn’t affect our findings.
Speaking of findings, now that we’ve gotten all the definitions out of the way, let us get on to our true purpose in life:
Doing Science to a Boardgame
So we have then is a program that will play a million games, each involving 4 players all of whom select an option at random (where each option is uniformly likely) whenever they are faced with some sort of choice. After all games have been played, we compute the number of coins that each type of establishment earned in a single game on average and plot that as an indication of how helpful it is to purchase that type of establishment:
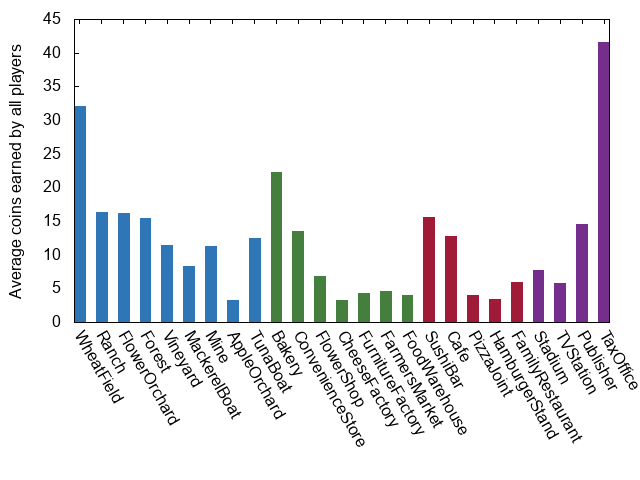
This plot seems to suggest that the Tax Office is by far the best establishment in terms of financial return. This does not at all agree with my experience playing the game, so I investigated. It turns out that if you always make choices randomly, you will miss some obvious choices a lot of the time. In particular games were taking a very long time to complete simply because players took a long time to randomly elect to buy their last landmark. So I upgraded our “random” player with some minor intelligence such that they now will always purchase a landmark that they can afford after the 10th turn. Running the simulation again gave a far more sensible graph:
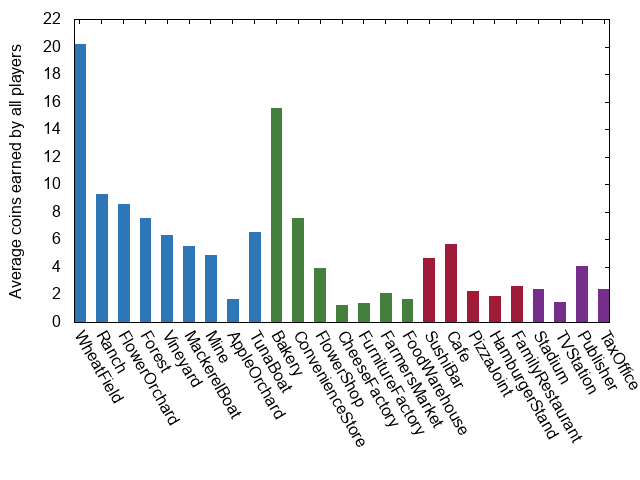
The two major spikes here are for the wheat field and bakery, which I will choose to believe is simply a result of the fact that those are the starting buildings and therefore have more time with which to earn coins. That said, there does seem to be a bias towards those establishments that can activate when players roll only a single die. Applying the same healthy dose of guesswork as before, we arrive at the conclusion that this is a consequence of how infrequently our random bot actually rolls both of their available dice (consider that before they purchase the Train Station they can’t roll two dice, and after that still only roll two dice 50% of the time). This seems like it would be a strange way to play since the 7-14-activation cards appear to have higher potential payouts (and avoid the chance of losing to Sushi Bars). So we take another hard-left turn away from Randomville and instead opt to roll two dice every time that we are able:
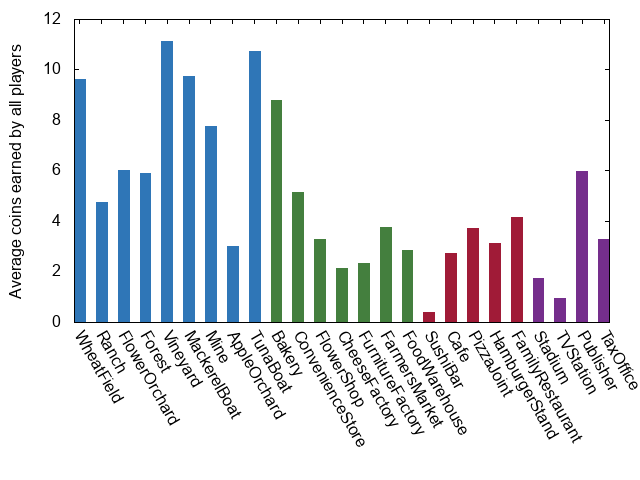
There we go! That looks a lot more like what I would expect to see. However I have two observations to make at this point:
- You will note that in all of these graphs, Apple Orchards have not been faring particularly well (which suggests that they are indeed bad cards), and
- If you were a player that had at least one Tuna Boat or Farmers Market, surely we would want to consistently activate our Harbor?
Admittedly if we had neither of those two we would have no reason to ever activate our Harbor, but lets see what happens if we force our decreasingly-random bot to always activate their Harbor when able:
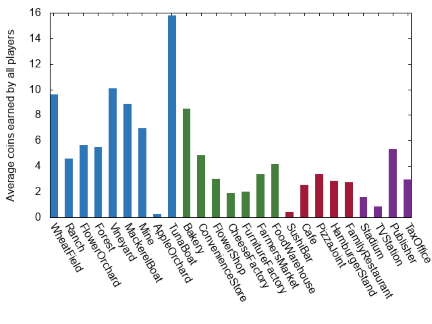
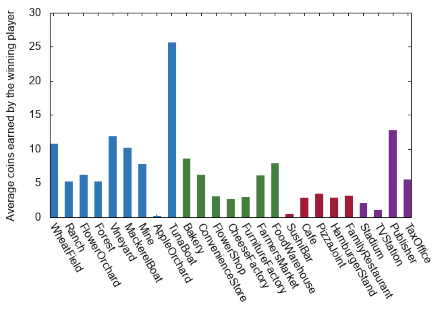
Well if there had been any doubt before that the Harbor/Tuna Boat combo makes all the apple farmers sad, there isn’t much left now. Another interesting thing to note about this pair of graphs is that the earnings by Tuna Boats for winning players is more than the earnings for all players by a margin significantly larger than we have for the other establishments. This further supports our suspicion that Tuna Boats are too strong by suggesting a correlation between winning players and Tuna Boat income. What can be done about that though? Tuna Boats are interesting to play with because they don’t provide a set number of coins so we don’t want to get rid of them…but what if we just got rid of some of them? What if we started the deck with only 2 Tuna Boats, rather than 6?
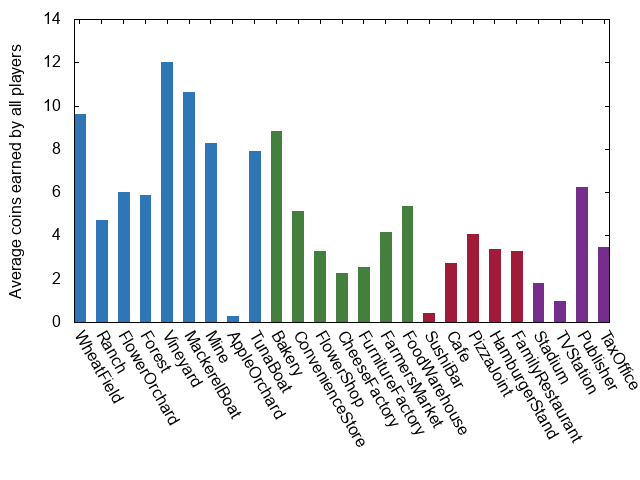
That’s a lot better! Apple Orchards are still bad it would seem, but at least the average earnings by Tuna Boats is now a lot closer to that of the other establishments. I haven’t included the graphs here but the same situation appears to be true if we only count earnings for winning players. I haven’t tried playing an actual game like this but I can envision a world in which this isn’t fun to play because the one or two people that do get Tuna Boats might just win a disappointingly large fraction of the time. Another option that gets around this would be to just have the Tuna Boat roll one die on activation, rather than two:
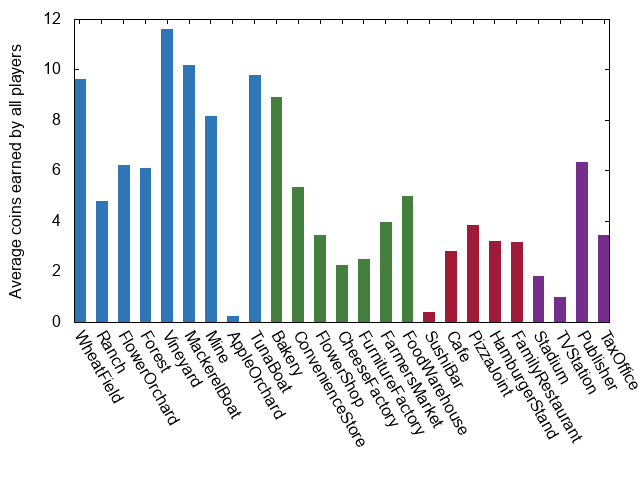
That seems to work too! Now that we’ve nerfed Tuna Boats, what about Apple Orchards? Well maybe now that there are fewer Tuna Boats (or the ones we have aren’t quite as explosive), lets try give some randomness back to our “random” player, and let them randomly choose whether or not they want to activate their Harbor. I’m going to take this as a simulation of the fact that maybe they don’t have any Tuna Boats, or maybe they do but they have many Apple Orchards and don’t fancy their chances. Whatever the reason, here’s what our million games tells us:
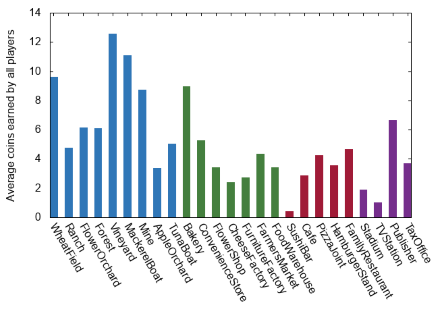
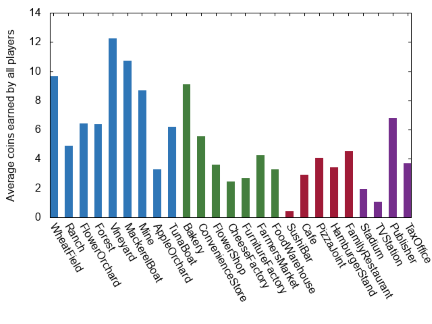
Success! We seem to have managed both to nerf Tuna Boats somewhat and to bring Apple Orchards (ever so slightly) back into the world of profitability. You even have a choice of means by which to achieve it! I must add that all of this should be taken with a sizable grain of salt, mostly because randomly-played games aren’t amazing approximations for human players but also because my implementation of the game could simply be wrong. If you’d like to check (or just run your own experiments), the source for my simulation is available on Github.